Raptisv Blog
It is usually not enough to just monitor a time series graph 24/7, we need to identify spikes and also get alerted.
Check out the Github repository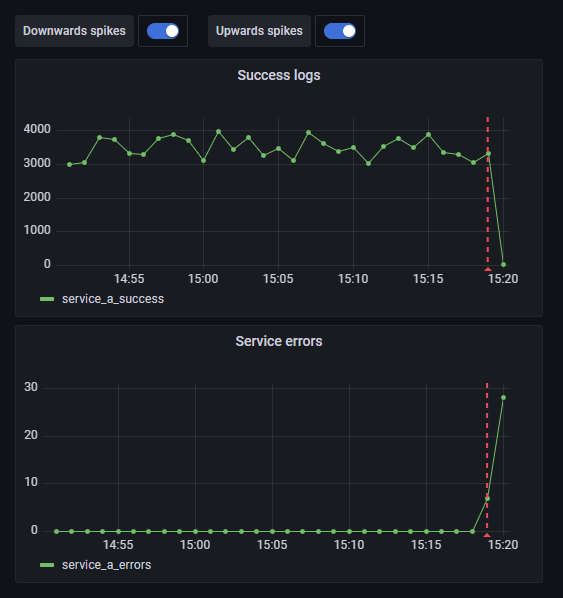
TL;DR
This project
-
Periodically fetches histogram data from
Graylog, based on custom queries -
Persists that information using
SQLiteto prevent spamming on Graylog api -
Identifies upwards or downwards
spikes realtime(optionally sends an alert) -
Serves all the above information in
Grafanausing SimpleJson datasource
The problem
Graylog dashboards can display time series graphs, based on custom queries, but the experience is not the best, while Grafana is great for the job. Also, you may need to process the information before displaying it to the graph. By far, the most common data processing upon time series information is anomaly detection.
Additionally, it is often not easy to predict in advance, all the metrics you need to be displayed in Grafana (usually through Prometheus). Since all the information is usually on Graylog, you may need to monitor some custom Graylog queries for some time, before turning it to metrics.
Run with Docker
-
On directory
..\Time.Series.Anomaly.Detection\dockerexecutedocker-compose -p graylog2grafana up -d. This will create a docker compose including Graylog, Grafana & the current Graylog2Grafana solution -
When compose is up, you can navigate to Graylog, Grafana and Graylog2Grafana using the default credentials
username: adminandpassword: admin - At this point Graylog2Grafana has already started loading histogram data from Graylog. You can add, edit or delete custom Graylog queries here. Only thing left to do is to setup a Grafana dashboard in order to display that data
Setup Grafana
- Navigate to Grafana
- Install plugin SimpleJson
-
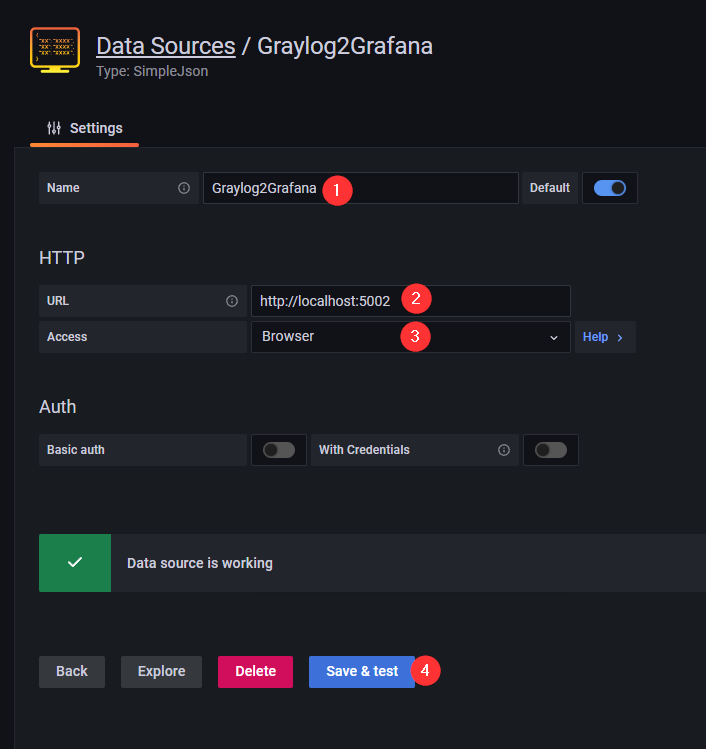
Navigate to datasources and add SimpleJson as a datasource
-
Set the name to
Graylog2Grafana - Set the url to http://localhost:5002
-
Set the access to
Browser -
Click on
save & test -
Create a new dashboard and inside it a new
empty panel -
When editing the panel
-
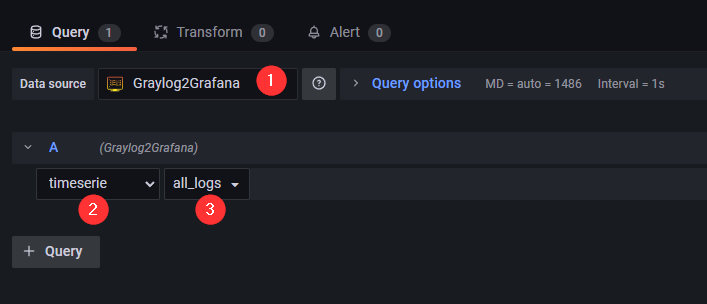
Set the datasource to
Graylog2Grafana -
Select
timeserie -
Select
all_logs<- This is just a demo predefined query. All your new custom queries will be available here to select
-
Set the datasource to
-
Set the name to
Anomaly detection
Anomaly/spike detection is executed in the background, everytime the queries refresh their data. We usually care about realtime data, that is why it will produce an alert only if an anomaly was detected in the last minute.
The library used for anomaly detection is ML.NET. You will find and excellent guide of how to start with ML.NET time series in this documentation.
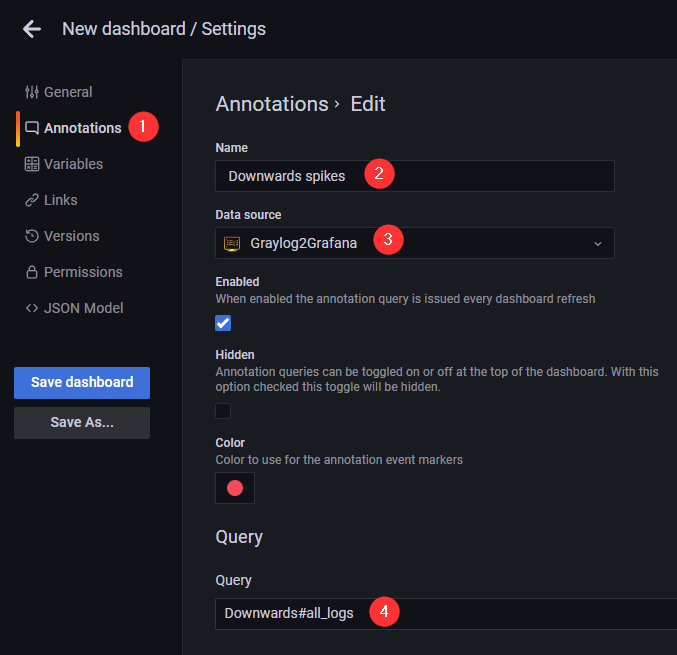
In order to see the spikes detected in Grafana, we have to setup Dashboard annotations. Go to the Dashboard settings and add a new Annotation query with the following settings
-
Set Name to
Downwards spikesor something similar -
Set Data source to
Graylog2Grafana -
Set the query to
Downwards#all_logs<- This is a convention explained below
The query field on Step 3. is a convention we have to make. The format here is {MonitorType}#{query_name_a}#{query_name_b} (notice the # separator). Available values for MonitorType are Downwards and Upwards depending on the type of spikes we wish to see in the dashboard. After the type we include the Graylog custom query names we wish to see in the dashboard. For example the Downwards#query_a#query_b#query_c means that we want to see all downwards spikes for custom Graylog queries query_a, query_b and query_c. If you wish to monitor all your queries you may set a * like Downwards#*.
Alerting
Detected spikes are going to be displayed in the Grafana dashboard as explained above. Optionaly, you may setup a Slack channel id and auth token in the configuration, in order to receive the relevant notification in Slack also.
Enjoy monitoring you custom Graylog queries 😊


